Monday 7 September 2015

New XStream Modem

This week, we tested out our new modem that we bought. It is the XStream OEM RF Module. We first connected it to the software (XCTU) and configure the new modem. Since this is the newer version of modem, a newer softaware of XCTU is required for the configuration of the radio with the wire antenna. Both modules (receiving and transmitting) must have the same baud rate (19200), Hopping Channel (1) and Destination Channel (8). Then we used the modem for range testing. After range testing, we tried sending data with the arduino as well as receiving with PLX-DAQ.
Xstream Module

Readings received by Computer through DAQ

Base Board

XStream with RPSMA Antenna

XStream with wire antenna

Saturday 5 September 2015

Can Bus and Printed PCB

For this week, we completed in the communication of the Can Bus as well as printed out the PCB board that connects the outputs from various parts of the car to the Arduino Mega.

For the Printed PCB, we used the Eagle Software to design. After that, we saved and converted the file using the CAM Processor Software in the Eagle to achieve 3 types of files (.sol, .sts, .drd) . The files are then sent to a PCB making machine for printing.

Board Drawing using Eagle Software

Files Required for Printing


Printing Process using PCB printing machine 
Machine Used


Printed PCB


For the CAN Bus, we tried to get the Arduino CAN bus shield to communicate with the Can Bridge of the BMS. This communication line is important as we will be able to get accurate information for the battery during the race.
The Hardware wiring at the CAN Bridge and the CAN Bus Shield is different. Therefore, we are required to come up with a connector between the two.( Connecting the CAN high and low respectively at both ends)
As for the software, we used our programme for the Arduino. There are a few columns and IDs during the communication. D0 to D7 are bytes of Data transmitted while ID determines the origin of the Data (CMU or BMU unit e.g 601 represents the CAN bridge D0 to D4 is the serial number of the bridge, D4 to D7 is the cell and CMU temperature respectively). All Data transmitted are in Hexadecimal so conversion to Decimal needs to take place in order to tally information from the BMS management software. Conversion headers will be included in our main program.  


Data Received


Friday 31 July 2015

WEEK 15

For this week, we are required to create a new program in order to determine the speed the SunSPEC 4 will be travelling at. This is due to the motor controller's output being restricted to a pulse output, as compared to the SunSPEC 3's motor controller, being able to output a voltage as well as a pulse output. As a result, the previous program that we had for speed measurement now need to be replaced with a new program.

Through researching on the internet, we found various codes that we would be able to use after some adjustments. The program below shows of a program we tried to implement into our system

Due to various time constraints, we are unable to test the program to see the effectiveness. In the next week, we would try to test the program and troubleshoot any problems we might encounter. 


Week 13

Testing of current sensor

For this week, we tested the 5mA current sensor. The current sensor requires a reference voltage of 2.5V. To get the reference voltage, we used the 5V output and pass through a voltage divider formed by 2 resistors of any same value. The output will be determined by the current flowing through the circuit. We tested the highest and lowest current and it verified the range stated on the sensor of 2.5 +/- 0.625V.  Input of current is firstly done by a 9V battery, followed by a portable power supply.

5mA sensor connection with battery

Tuesday 14 July 2015

WEEK TWELVE: 6 July to 12 July 2015

Task 1: GPS Logging with PLX-DAQ

Previously, we have successfully read and print the GPS coordinates in the Arduino Serial port. This week, we managed to logged the coordinates from GPS module to the PLX-DAQ.

Failed Attempt (1). No Coordinates Shown
Failed Attempt (2). Latitude and Longitude are in the wrong column
Even thought the columns are wrong, the GPS Coordinates are already correct. Thus, we decided to be more ambitious and added in the distance calculation as well!

After many failed attempts, we finally got the GPS coordinates as well as the distance (or rather displacement) calculation to be displayed and logged on PLX-DAQ.

Testing @ Stadium along the track
The distance calculation is rather accurate as tested at the running tracks. However, if we want to calculate distance traveled, a more accurate way would to calculate via speed of car.


Task 2: Data Transmission with PLX-DAQ

Previously, we tested out the range of transmission of our modem. However, the source of the info transmitted is from our computer directly. For Sunspec 4, we are using the Arduino Mega to collect all the info and transmit it out. So how do we connect the Arduino to the modem?

Connection at the Transmission End
Schematic Diagram for Max232 Chip

We connected the arduino to the modem using an Max232 board. There will be 2 tracks : tranceiver and receiver. Half of the both tracks are connected to the modem and the other half to the Arduino, both tracks going in opposite directions.

Connection of receiving end
Data received by PLX-DAQ
 The modem on the receiving end can be connected to the laptop directly. Data can be logged through the PLX-DAQ software just by changing the port number to the port number of the modem.


Tuesday 7 July 2015

WEEK ELEVEN: 29 June to 3 July 2015


Task 1: PLX-DAQ

In order to have our data saved in an excel form for easy analyzing in the future, we have to extract the information from the Arduino. The software that we can use to directly send data over to excel is call PLX-DAQ.

Figure 1. PLX-DAQ Interface
Figure 1 shows the PLX-DAQ user interface. When the arduino is connected, set the serial port on the PLX-DAQ and run the program by clicking connect. 

But before that... There are some standard codes! We will use this simple code to explain how DAQ works.

double y = 2.14;   //y is a constant 

void setup() 
{
  Serial.begin(128000); // Sets baudto 128000 bps, set to 128000 on PLX-DAQ as well
  Serial.println("CLEARDATA");   //this is the standard code to include in order to print to 
  Serial.println("LABEL,Time,x,xy");   //printing the headings for DAQ. 
                                                               //LABEL must be included in front of each parameter
                                                               //Time is the time on our computer
}

void loop() 
{
  double x=random(20);   //generate a random number between 0-20
  double xy=x*y;   
  
  Serial.print("DATA,TIME,");    //standard code to initiate data & time display
  Serial.print(x);    //print out parameter x on on column
  Serial.print(",");   //comma doesn't gets printed out but it will move to the next cell
  Serial.print(xy);    //print

  row++;   //moving onto the next row

//this is to limit number of rows
  if (row > 360) 
   {
    row=0;
    Serial.println("ROW,SET,2");
   }
  delay(500);

}

Figure 2. Testing of DAQ
With this knowledge, we are able to send data to DAQ from the arduino and then logged in the parameters. At the end of race day, we can cross check them.


Task 2: Data Logging with Ethernet Shield

Apart from the distant transmission of data via modems, we also need to log data locally from the source - SunSPEC 4. This is so that we have a backup when there is a cut off in our transmission. We tested out data logging using the Ethernet shield. Data logger shield would be a more preferable method, however we do not have any at the moment.

Figure 3. Data collected 

Using the Ethernet shield, we connected it directly above the arduino. Using the above program, we are able to log data from the non invasive current sensor connected to a circuit. There is also a SD card slot which allows to log data and improve the reliability of the data shown on the serial monitor. However, connecting directly above the arduino shows an inaccurate reading of data. The data should be 2.5 V compared to the data collected of 2.74V at 0A. Hence, the test concluded that this is not the best way to log data.

Processing data in notepad to excel

Figure 4. Processing data from txt to excel file
During the race, we will require a good and clear display of data for analysis and one way is to put it into excel file. Besides using the PLX-DAQ to log data into excel, what if data is collected in note form or other forms? Actually, microsoft excel allows us to convert those files into excel without the need to install additional drivers or softwares.

Sunday 28 June 2015

(Vacation) WEEK TEN: 22 June to 28 June 2015

Task 1: CANBUS - Ethernet Testing

The Ethernet Shield was tested in order to verify that communication can be done in the CAN bus system.

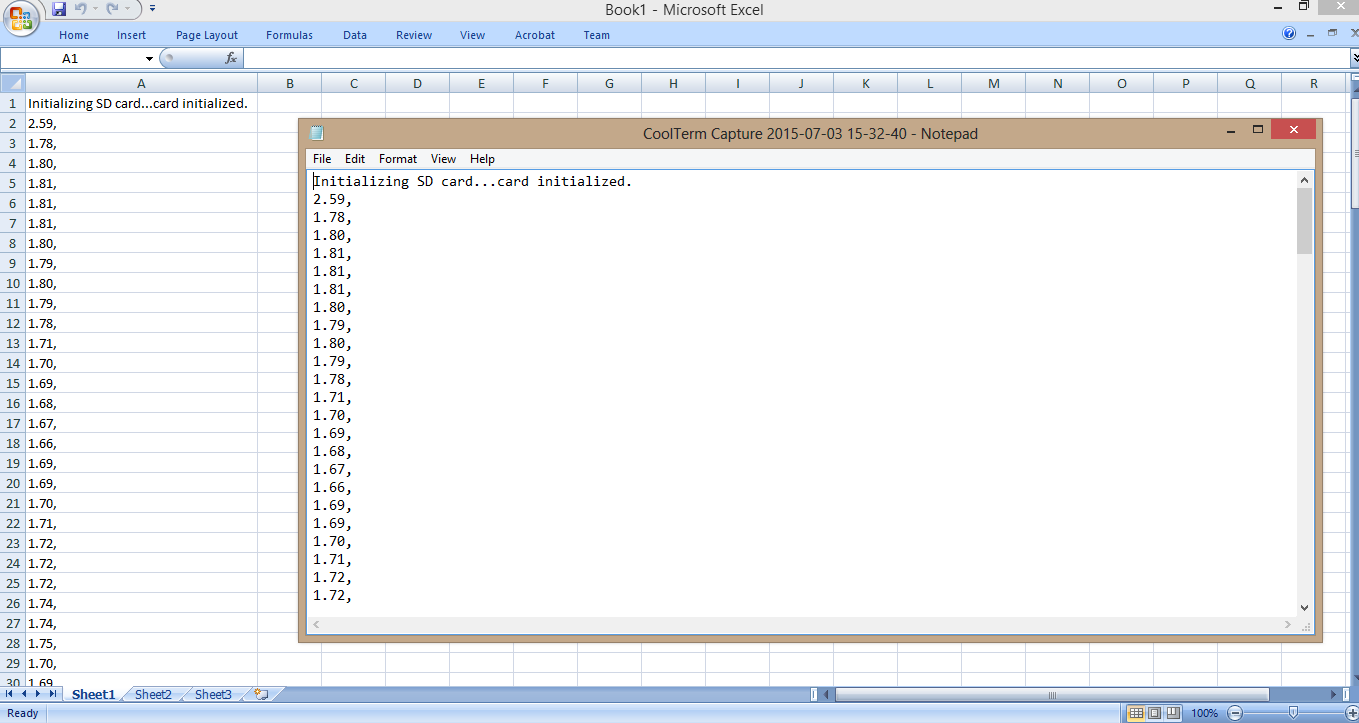
We tested the Ethernet shield to check if we can connect the Arduino to a specific IP address. Therefore, when we key the IP address of the Arduino code into our web browser, we would be able to see the readings for the analog pins.

The IP address would be of a similar range to the IP address of the router that we are using. The figure below would show the results that we have obtained from testing the Ethernet Shield

Figure 1. Ethernet Shield Testing Results


Task 2: Logging GPS Coordinates

This week, we managed to get the GPS module EM406 talking to the satellite. Testing was done at various locations to ensure that the GPS coordinates are accurate. The accuracy of GPS module depends on the location that we are at. It was difficult to obtain accurate coordinates indoors as the satellite was not communicating well with EM406. Thus, It would show an "INVALID" on our serial port as shown below. 

Figure 2. GPS Tracking Program and Serial Output
We were able to obtain the accurate readings once we are in open air and the module is communicating with the satellite. When moving, the coordinates also changes. The date and time logged by the GPS module is GMT timing. This means that during the actual race, we would have to convert the time to Australia timing. 

In order to get the GPS program to run, the tinyGPS++ library have to be installed. Appendix is our program for testing the module. 

#include <TinyGPS++.h> //include this library for the GPS to work
#include <SoftwareSerial.h> //this is the GPS software serial library

// Choose two Arduino pins to use for software serial
// The GPS Shield uses D2 and D3 by default when in DLINE mode
int RXPin = 2;
int TXPin = 3;

// uses 4800 baud by default
int GPSBaud = 4800;

// Create a TinyGPS++ object called "gps"
TinyGPSPlus gps;

// Create a software serial port called "gpsSerial"
SoftwareSerial gpsSerial(RXPin, TXPin);

void setup()
{
  // Start the Arduino hardware serial port at 9600 baud
  Serial.begin(9600);

  // Start the software serial port at the GPS's default baud
  gpsSerial.begin(GPSBaud);

  Serial.println(F("DeviceExample.ino"));
  Serial.println(F("A simple demonstration of TinyGPS++ with an attached GPS module"));
  Serial.print(F("Testing TinyGPS++ library v. ")); Serial.println(TinyGPSPlus::libraryVersion());
  Serial.println(F("by Mikal Hart"));
  Serial.println();
}

void loop()
{
  // This sketch displays information every time a new sentence is correctly encoded.
  while (gpsSerial.available() > 0)
    if (gps.encode(gpsSerial.read()))
      displayInfo();

  // If 5000 milliseconds pass and there are no characters coming in
  // over the software serial port, show a "No GPS detected" error
  if (millis() > 5000 && gps.charsProcessed() < 10)
  {
    Serial.println(F("No GPS detected"));
    while(true);
  }
}

void displayInfo()
{
  Serial.print(F("Location: ")); 
  if (gps.location.isValid())
  {
    Serial.print(gps.location.lat(), 6);
    Serial.print(F(","));
    Serial.print(gps.location.lng(), 6);
  }
  else
  {
    Serial.print(F("INVALID"));
  }

  Serial.print(F("  Date/Time: "));
  if (gps.date.isValid())
  {
    Serial.print(gps.date.month());
    Serial.print(F("/"));
    Serial.print(gps.date.day());
    Serial.print(F("/"));
    Serial.print(gps.date.year());
  }
  else
  {
    Serial.print(F("INVALID"));
  }

  Serial.print(F(" "));
  if (gps.time.isValid())
  {
    if (gps.time.hour() < 10) Serial.print(F("0"));
    Serial.print(gps.time.hour());
    Serial.print(F(":"));
    if (gps.time.minute() < 10) Serial.print(F("0"));
    Serial.print(gps.time.minute());
    Serial.print(F(":"));
    if (gps.time.second() < 10) Serial.print(F("0"));
    Serial.print(gps.time.second());
    Serial.print(F("."));
    if (gps.time.centisecond() < 10) Serial.print(F("0"));
    Serial.print(gps.time.centisecond());
  }
  else
  {
    Serial.print(F("INVALID"));
  }

  Serial.println();
}

We hope to get GPS coordinates and have it displayed on DAQ so that we can save the file for analysis. 

Monday 22 June 2015

(Vacation) WEEK NINE: 15 Jun to 21 Jun 2015

Task 1: Voltage Signal Attenuation

When looking back at the voltage measurement for the battery, we realise that there is much to be improved with the circuit that we came up with so far. Therefore, we looked into ways of improving the circuit of the voltage measurement, while improving the accuracy of our measurements.

Thus, we have looked into one of the suggestions given by our lecturers, to use a current sensor and a resistor to be connected in parallel with the SunSPEC 4's motor. This would thus omit the danger for shorting the high voltage and low voltage sides, while allowing us to implement circuits that boosts the sensor's sensitivity.

Figure 1 would show the circuit diagram. Note that the circuit does not include the solar panels as a power source, as we want to show the measurement of the battery voltage.

Figure 1. Voltage Sensing Circuit Diagram


Task 2: Current Amplifier

After connecting the current sensor and resistor in parallel with the car's motor, we are implementing a circuit that boosts the current sensor's sensitivity. In Figure 2 below, the V1 is referring to the current sensor's output.

Figure 2. Current Amplifier Circuit Diagram
Task 3: Current Calibration

The current sensor that we got is a hall-effect sensor. We tested it out to obtain the sensitivity and accuracy of the sensor. The power supply can supply 0 - 3.25 ampers. Thus, we experimented and obtain readings for every 0.1A. 

Figure 3. Set up of current calibration
Figure 4. Voltage - Current Graph
From our experiment, we noticed a change of 0.01V for every 0.1A change. The sensitivity of the sensor is roughly 100mV/A, which is much higher than our initial current sensor. However, the loop is very small and fits up to AWG12 only. We still have to look into other sensors as motor and battery side requires AWG8.


Saturday 13 June 2015

(Vacation) WEEK EIGHT: 8 Jun to 14 Jun 2015

Task: GPS Tracking of Solar Car

In 2013, the GPS module was placed on SunSPEC3 for the GPS coordinates. By placing the GPS module on the solar car itself, a more accurate terrain can be plotted.

Figure 1. Plotting altitude against distance
The above figure is the terrain obtained by the SunSPEC 3 team after the race. GPS tracking allows us to know the conditions of the route. With reference to the route profile, the telemetry team is able to strategize for the car to perform optimally.

As we will be using Arduino for programming, GPS module and GPS shield must be arduino-compatible. In this case, we looked into the GPS Receiver Module (EM-506).
Figure 2. GPS Receiver EM-506 Module
This receiver module has 48 frequency channels to choose from. It has extremely high sensitivity. Current drawn is small which is favourable as we have limited power from solar panels and batteries.

With the help of an Arduino GPS Shield and data logging shield. The GPS coordinates can be transmitted to computer and data can be saved for analysis. 

Figure 3. Arduino UNO with GPS Shield and EM-506

Programming of GPS tracking is rather easy with tutorials in the arduino library. Here's an exampe of the GPS program: 
Figure 4. Schematic of GPS tracking with Display
How to use the GPS Shield?

In order to operate the GPS, some settings must be done on the GPS Shield itself. 

There are two switches, one of  it is the power switch to turn on and off the GPS. The other one is the UART / DLINE switch, which controls how the Arduino communicates with the GPS Module. 

When set to UART mode, it will configure the board to use the hardware serial, which is the built-in Arduino hardware serial. It uses pin 1 and 2 for transmitting and receiving, communicating with the satellite. 

When set to DLINE mode, the board will be configured to use the software serial. The software serial library must be included in the code for the program to run. By default, pin 2 and 3 will be used for transmitting and receiving. 

In order to upload a program to the Arduino with GPS shield attached, switch must be set to DLINE mode.

Sunday 7 June 2015

WEEK SIX/SEVEN: 25 May to 7 Jun 2015

Task 1: CAN Bus
Figure 1. CAN Bus Shield, Arduino compatible
Our team tried to program the CAN Bus shield this week with a simple program found in the arduino library. CAN Bus is important as it allows us to communicate with parts of the system such as the battery management system. At the same time, CAN Bus shield also has the ability to log data, which enables us to so that we could allow the arduino to be CAN Bus compatible and the ability to communicate and log data from the rest of the system. The CAN Bus shield can just be placed above the arduino for compatibility use. This CAN Bus shield has a RS232 input socket which will allow it to transmit data using a cable. It also has a memory card slot which will allow it to log data accurately. Due to the fact that the data transmitted is by wireless, there is a possibility that data may be lost along the way. The memory stick can be used as a backup as well as cross checking the data recorded by the chase vehicle.


Task 2: RF Modem


Figure 2 (a). XStream Modem 
Figure 2(b). Xbee Modem

RF Modem is used for wireless transmission of data from the solar vehicle to our chase vehicle. Modems used come from Xbee(Fig 2)  and Xtreme(Fig 1). When doing past technical testing, the Xtreme performs more reliably than the Xbee. The Xtreme covers a further range compared to the Xbee modem, although Xbee is stated to have a further range than the Xtream modem. Thus,in 2013, the Sunspec 3 uses the Xtreme modem. Like wise, for 2015, we will be using Xtreme for Sunspec 4.

Configuration of the xstream modem is via the software X-CTU. It can be installed with a disk that comes with xstream modem, while having the modem plugged into your computer. This is the first testing that we did indoors at T10 level 2. The software PuTTY is a window to see the received data. Otherwise, the "terminal" tab can also see the transmitted data. 

Figure 3 (a). Testing of xstream modem when staying still
Figure 3(b). Terminal Tab of X-CTU

Then, our team brought the transmission outdoors. We headed to 11 Square and get the modems tested out with one of the modems moving away.

Melvin & Siti Staying put
Jingwen, Dzul & En han bringing the modem for a walk :D

Here's the result!
Figure 3(b). Testing of xstream modem while walking
The transmission is successful and signal was not blocked when we moved behind the pillar. 
Now we would need to get the Xstream to talk to the arduino!

Sunday 24 May 2015

WEEK FIVE: 18 May to 24 May

Task: Driver Display

SunSPEC4 requires a driver display. This week, we sourced for suitable displays. Below are some considerations that we took:

  • Size of the display. The display should be able to show all the necessary parameters, but also fits into the limited space in the car.
  • Power consumption. As we have limited power from the battery, reliance on solar energy is high. A suitable display should be one that draws as little power from the system as possible, in order to utilize more of the power generated to driving the motors. 
  • Arduino compatibility. Programming will be done with Arduino unit, therefore the display must be able to receive inputs from Arduino.
  • Aesthetics. We are aiming to have a display that is pleasant-looking.

The parameters that the driver's display should have includes:
  1. Solar string currents
  2. Total solar power produced
  3. Instantaneous speed
  4. Average speed
  5. Battery power consumed
  6. State of charge

In SunSPEC3, a 20x4 LCD was used to display the various parameters. The data is neat and organized. Arranged in 3 columns, the driver was able to get real time information from the small display. 
Figure 1. 20 x 4 LCD in SunSPEC 3

In SunSPEC 4, we want to explore the options of graphical LCDs or even tablet as display. The advantages of the graphical LCDs and tablets are such that they are easier to look at for data analysis, allowing the driver to do a quick planning during the race.
Figure 2. Graphical LCD with Arduino
The above photo extracted from nathan.chantrell.net shows that a graphical LCD. It is arduino compatible and source codes and tutorials can be found in the arduino library. The resolution, however, is not enough for an ideal display.
Figure 3. 5" SSD1963 TFT Touch Screen Display
We also looked into the optical light emitting diodes. The TFT Touch is made by joining various optical LEDs. OLED is brighter than the regular green/black LCDs. A clearer and higher resolution is provided as well. However, it is expensive and may require a shield in order to function with arduino.

The ASUS Nexus 7 would be the best option for driver's display in terms of size, resolution and aesthetics. It is an android tablet which made arduino programming possible via ArduinoDroid. 
Figure 4. ASUS Nexus 7 Tablet
Figure 5. ArduinoDroid on ASUS Nexus 7 Tablet
This 7" tablet draws roughly 16W per charge. One full charge is able to withstand 8-10 hours of usage. During the race, the display will be constantly on for about 9 hours each day. This means that each day we will have to spare 16W for the tablet if we were to choose this. 

Currently, we are looking into the ASUS Nexus 7 for its benefits. However, if power consumption does not permit, the 20x4 LCD is always an alternative for us. 

Monday 18 May 2015

WEEK FOUR: 11 May to 17 May 2015


Task 1: Voltage Divider Circuit

As most of our sensors and controllers operate on 5 volts or less, we would require a voltage divider circuit in order to ensure that there is 5 volts to operate the necessary circuits.
Figure 1. Voltage Divider Circuit
The principle of a voltage divider is shown in the circuit above. Using 2 resistors, the voltage measured by the voltmeter at the particular point will be just a fraction of the original voltage. The output voltage is directly proportional to the source as well as the ratio of the resistors used in the design. In Sunspec 4, we will be designing our own circuit using the same principle to achieve a low voltage from a high voltage. 


Task 2: Optocoupler Circuit
Figure 2. Voltage Isolation Circuit using Optocoupler
Due to the fact that we are dealing with high voltages, there is a high chance of compromising the user's safety as well as damaging components used in the telemetry system. Therefore, a voltage isolation circuit is required. An optocoupler circuit is used to allow this to happen. For this circuit, the input voltage will be proportional to the output voltage. The larger the input voltage(1 and 2) , the brighter the LED in the circuit, the more light detected, the higher the output at the end of the circuit(3 and 4).


Task 3: Differential Amplifier


Figure 3. Differential Amplifier
This circuit is used to obtain more accurate readings for our uni-directional sensors. For a bidirectional sensor, a base voltage of 2.5V is inputted so that it raises the measuring range from 0V to 2.5V out of 5V. 0 to 2.5V is used for negative flow of the current detected by the sensor. Since unidirectional sensors only sense one sided flow of current, the range of measurement is limited to 2.5 to 5V, which decreases our accuracy in readings.( Possibility of voltage less than 2.5V). Input voltage from the sensor will be inputted into one of the inputs while the other one will be kept at 2.5V to offset the rise in range caused by the design of the sensor.