Sunday 3 January 2016

World Solar Challenge 2015

Happy New Year Everybody!!!!!

WSC 2015

The race has been fun and exciting. Along the way, there has been lots of problems and troubleshooting needs to take place.

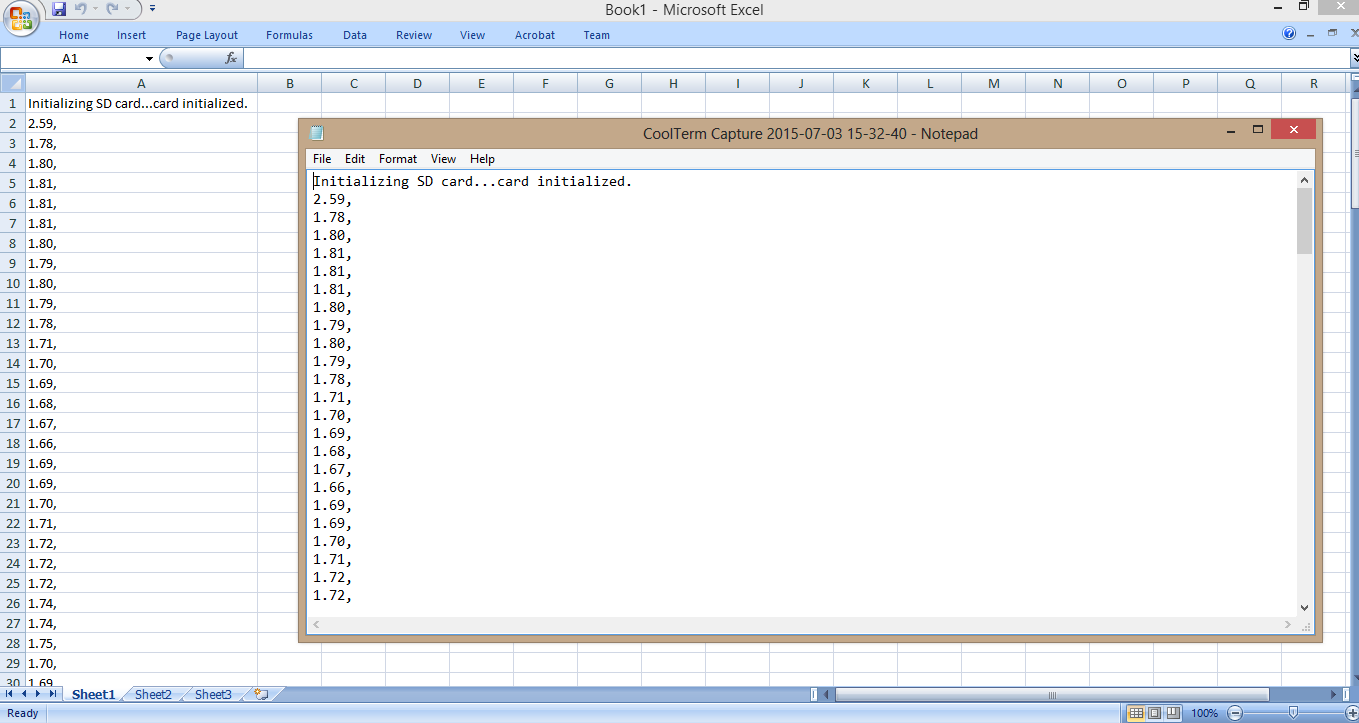
Some problems are: Unstable readings from the current sensors, intermittent transmission of data from modems, unstable and inaccurate readings for motor pulses

5.1 Current Readings

Firstly the current readings from the current sensors provided us with readings that were too unstable due to its sensitivity and thus causing the readings obtained to fluctuate too much. Furthermore, during certain times, some of the readings obtained were not proportional to the variables it was supposed to measure, such as when the accelerator paddle wasn’t pressed on, the current sensor of the motor read an increase in current. 

5.2 Speed Measurement

Secondly unstable and inaccurate motor pulses causes the vehicle speed on display to be inaccurate. Noise generated in the surroundings causes the intermittent spiking of readings. Spiking can also occur whenever the driver start to step on the accelerator, thus causing the speed display not proportional to the actual speed of the motor.

5.3 Transmission

Transmission of the modems in the solar car and chase vehicle is inconsistent. During the race, transmission works well when the solar car is driving at an average distance of within 300m ahead of the chase vehicle. Results obtained were rather accurate for this safety distance. However, whenever the car tries to speed up or is on the trailer, distance between the solar car and chase vehicle has to increase for safety reasons. Transmission of data is not as accurate due to noise. Also, there are longer pauses between data.  

Monday 7 September 2015

New XStream Modem

This week, we tested out our new modem that we bought. It is the XStream OEM RF Module. We first connected it to the software (XCTU) and configure the new modem. Since this is the newer version of modem, a newer softaware of XCTU is required for the configuration of the radio with the wire antenna. Both modules (receiving and transmitting) must have the same baud rate (19200), Hopping Channel (1) and Destination Channel (8). Then we used the modem for range testing. After range testing, we tried sending data with the arduino as well as receiving with PLX-DAQ.
Xstream Module

Readings received by Computer through DAQ

Base Board

XStream with RPSMA Antenna

XStream with wire antenna

Saturday 5 September 2015

Can Bus and Printed PCB

For this week, we completed in the communication of the Can Bus as well as printed out the PCB board that connects the outputs from various parts of the car to the Arduino Mega.

For the Printed PCB, we used the Eagle Software to design. After that, we saved and converted the file using the CAM Processor Software in the Eagle to achieve 3 types of files (.sol, .sts, .drd) . The files are then sent to a PCB making machine for printing.

Board Drawing using Eagle Software

Files Required for Printing


Printing Process using PCB printing machine 
Machine Used


Printed PCB


For the CAN Bus, we tried to get the Arduino CAN bus shield to communicate with the Can Bridge of the BMS. This communication line is important as we will be able to get accurate information for the battery during the race.
The Hardware wiring at the CAN Bridge and the CAN Bus Shield is different. Therefore, we are required to come up with a connector between the two.( Connecting the CAN high and low respectively at both ends)
As for the software, we used our programme for the Arduino. There are a few columns and IDs during the communication. D0 to D7 are bytes of Data transmitted while ID determines the origin of the Data (CMU or BMU unit e.g 601 represents the CAN bridge D0 to D4 is the serial number of the bridge, D4 to D7 is the cell and CMU temperature respectively). All Data transmitted are in Hexadecimal so conversion to Decimal needs to take place in order to tally information from the BMS management software. Conversion headers will be included in our main program.  


Data Received


Friday 31 July 2015

WEEK 15

For this week, we are required to create a new program in order to determine the speed the SunSPEC 4 will be travelling at. This is due to the motor controller's output being restricted to a pulse output, as compared to the SunSPEC 3's motor controller, being able to output a voltage as well as a pulse output. As a result, the previous program that we had for speed measurement now need to be replaced with a new program.

Through researching on the internet, we found various codes that we would be able to use after some adjustments. The program below shows of a program we tried to implement into our system

Due to various time constraints, we are unable to test the program to see the effectiveness. In the next week, we would try to test the program and troubleshoot any problems we might encounter. 


Week 13

Testing of current sensor

For this week, we tested the 5mA current sensor. The current sensor requires a reference voltage of 2.5V. To get the reference voltage, we used the 5V output and pass through a voltage divider formed by 2 resistors of any same value. The output will be determined by the current flowing through the circuit. We tested the highest and lowest current and it verified the range stated on the sensor of 2.5 +/- 0.625V.  Input of current is firstly done by a 9V battery, followed by a portable power supply.

5mA sensor connection with battery

Tuesday 14 July 2015

WEEK TWELVE: 6 July to 12 July 2015

Task 1: GPS Logging with PLX-DAQ

Previously, we have successfully read and print the GPS coordinates in the Arduino Serial port. This week, we managed to logged the coordinates from GPS module to the PLX-DAQ.

Failed Attempt (1). No Coordinates Shown
Failed Attempt (2). Latitude and Longitude are in the wrong column
Even thought the columns are wrong, the GPS Coordinates are already correct. Thus, we decided to be more ambitious and added in the distance calculation as well!

After many failed attempts, we finally got the GPS coordinates as well as the distance (or rather displacement) calculation to be displayed and logged on PLX-DAQ.

Testing @ Stadium along the track
The distance calculation is rather accurate as tested at the running tracks. However, if we want to calculate distance traveled, a more accurate way would to calculate via speed of car.


Task 2: Data Transmission with PLX-DAQ

Previously, we tested out the range of transmission of our modem. However, the source of the info transmitted is from our computer directly. For Sunspec 4, we are using the Arduino Mega to collect all the info and transmit it out. So how do we connect the Arduino to the modem?

Connection at the Transmission End
Schematic Diagram for Max232 Chip

We connected the arduino to the modem using an Max232 board. There will be 2 tracks : tranceiver and receiver. Half of the both tracks are connected to the modem and the other half to the Arduino, both tracks going in opposite directions.

Connection of receiving end
Data received by PLX-DAQ
 The modem on the receiving end can be connected to the laptop directly. Data can be logged through the PLX-DAQ software just by changing the port number to the port number of the modem.


Tuesday 7 July 2015

WEEK ELEVEN: 29 June to 3 July 2015


Task 1: PLX-DAQ

In order to have our data saved in an excel form for easy analyzing in the future, we have to extract the information from the Arduino. The software that we can use to directly send data over to excel is call PLX-DAQ.

Figure 1. PLX-DAQ Interface
Figure 1 shows the PLX-DAQ user interface. When the arduino is connected, set the serial port on the PLX-DAQ and run the program by clicking connect. 

But before that... There are some standard codes! We will use this simple code to explain how DAQ works.

double y = 2.14;   //y is a constant 

void setup() 
{
  Serial.begin(128000); // Sets baudto 128000 bps, set to 128000 on PLX-DAQ as well
  Serial.println("CLEARDATA");   //this is the standard code to include in order to print to 
  Serial.println("LABEL,Time,x,xy");   //printing the headings for DAQ. 
                                                               //LABEL must be included in front of each parameter
                                                               //Time is the time on our computer
}

void loop() 
{
  double x=random(20);   //generate a random number between 0-20
  double xy=x*y;   
  
  Serial.print("DATA,TIME,");    //standard code to initiate data & time display
  Serial.print(x);    //print out parameter x on on column
  Serial.print(",");   //comma doesn't gets printed out but it will move to the next cell
  Serial.print(xy);    //print

  row++;   //moving onto the next row

//this is to limit number of rows
  if (row > 360) 
   {
    row=0;
    Serial.println("ROW,SET,2");
   }
  delay(500);

}

Figure 2. Testing of DAQ
With this knowledge, we are able to send data to DAQ from the arduino and then logged in the parameters. At the end of race day, we can cross check them.


Task 2: Data Logging with Ethernet Shield

Apart from the distant transmission of data via modems, we also need to log data locally from the source - SunSPEC 4. This is so that we have a backup when there is a cut off in our transmission. We tested out data logging using the Ethernet shield. Data logger shield would be a more preferable method, however we do not have any at the moment.

Figure 3. Data collected 

Using the Ethernet shield, we connected it directly above the arduino. Using the above program, we are able to log data from the non invasive current sensor connected to a circuit. There is also a SD card slot which allows to log data and improve the reliability of the data shown on the serial monitor. However, connecting directly above the arduino shows an inaccurate reading of data. The data should be 2.5 V compared to the data collected of 2.74V at 0A. Hence, the test concluded that this is not the best way to log data.

Processing data in notepad to excel

Figure 4. Processing data from txt to excel file
During the race, we will require a good and clear display of data for analysis and one way is to put it into excel file. Besides using the PLX-DAQ to log data into excel, what if data is collected in note form or other forms? Actually, microsoft excel allows us to convert those files into excel without the need to install additional drivers or softwares.